|
The highlight for me this week was to find a pure stochastic divergence or what I call a Lane Divergence. George Lane was a technical analyst in the 50's and 60's that developed the Stochastic Oscillator.A momentum indicator that measures the momentum of a move so traders can get a idea when the market or security was getting ready to turn around. Lane was quoted about his stochastic indicator by saying " Stochastics measure the momentum of price. If you visualize a rocket going up into the air- before it can turn down, it must slow down. Momentum always changes direction before price." (and that's a fact).
Stochastics work on every time frame and every trading vehicle .Futures,Stocks, ect
So just the simple understanding of momentum and the example of the rocket. You can see how stochastics can give you that added edge to finding a good entry point. I use stochastics as the foundation to the HPS method. By combining basic trends support and patterns and the stochastics you really do find the Highest Probability area where a stock will turn.
This week we saw a text book Lane divergence on the 60 min time frame. And a pure divergence is not just an oversold or overbought stochastic reading it is a confirmation or a change of momentum before the price changes.
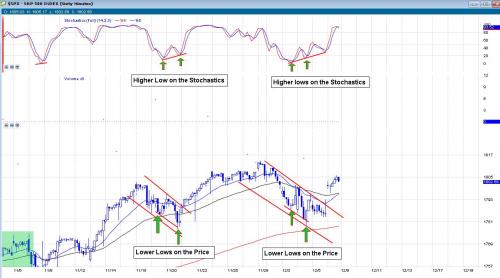
Because stochastics can get embedded ( meaning pinned in an extreme level usually above 80-90 or below 20-10) They are susceptible to false readings. When you add the 4 other indicators to the equation you lower that risk a lot, but it is still there. The key with the stochastics is looking for a pure divergence when the stochastics make a higher low but the stock price makes a lower low. This show the momentum slowing and shifting like a rocket that is peaking so after the price follows suit. Here are some examples and the last one will be the example that happened this week and predicted the move higher today. (Some might say it was the jobs report) The fact is the divergence was there and it is not a common thing so when you find it you better watch it.
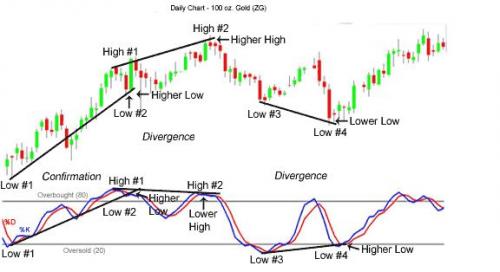
Basic Concept

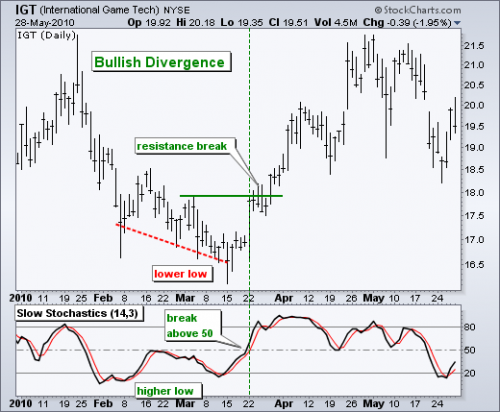
Examples

Example 2
Example of both bearish and bullish divergence (Print this chart to remember both)
This weeks Chart
Well that's it for now the new watch list is posted and the HPS stocks are updated
We have some great opportunities next week
you can view video here HPS watch list video
Its a long video and members could skip the first 19 mins if you want to get right to the set ups. But the first 19 mins has as always great education and reviews
DayTraderRockStar
Don't forget to lock in your membership if you are not a premium subscriber prices will be going up in January to $49.95/month from $29.95/month. This does not apply to current members they are locked in and never see these increases only the increases in value.
| 


