|
Video can be seen here after reviewing the post http://youtu.be/nVEBk5IkgQQ
Last Time we had a 60 minute set up we turned and headed up right on schedule.
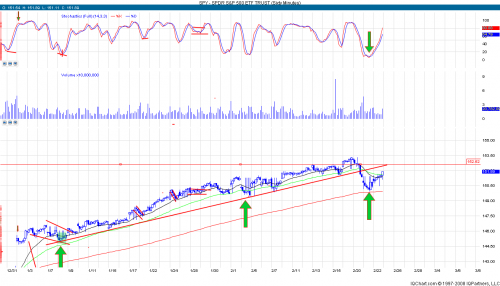
From that overbought level we pulled back into another 60 min buy signal and from there back up to an overbought level where we start off tomorrow.
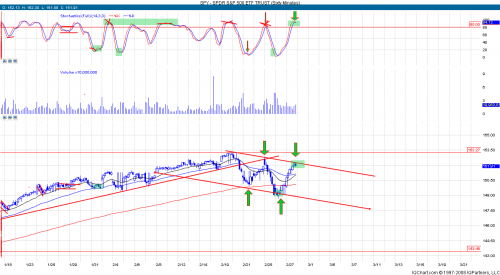
Indicators no doubt point to a sell here..short term..But the other influences in the market are not telling the same story.. Two days into the pullback and I had heard on every major media outlet about the correction that was happening..sure if you call 2 days a correction.. Market sentiment is a unseen indicator but probably one of the best. Market Sentiment could be described many ways and some of the unseen ones are usually something you can key in on if you pay attention.
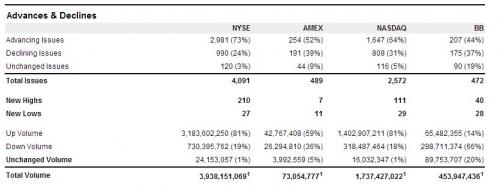
The first market sentiment gauge is based on statistics and what you might here called "Internals". It measures advancing and declining stocks, and stocks that are hitting new 52 highs and lows. This one is very easy to track and read. Todays read shows how bullish this move was,
Now I'll be honest with you...I don't use a/d's as much as I use other indicators, But it does add great clues on the strength of any rally or correction. Like a lot of indicators you want to look at divergences between the underlying market and the indicator in focus.
The above chart is displayed as an indicator called the a/d line or advance decline line
Below is a mumble jumble definition from stockcharts
The Advance Decline Line (AD Line) is a breadth indicator based on Net Advances, which is the number of advancing stocks less the number of declining stocks. Net Advances is positive when advances exceed declines and negative when declines exceed advances. The AD Line is a cumulative measure of Net Advances. It rises when Net Advances is positive and falls when Net Advances is negative. Typically, the advance-decline statistics come from the NYSE or Nasdaq on a daily basis. Chartists can plot the AD Line for the index and compare it to the performance of the actual index. The AD Line should confirm an advance or a decline with similar movements. Bullish or bearish divergences in the AD Line signal a change in participation that could foreshadow a reversal.
What I want to look at is the participation of stocks making new highs compared to if the market is making new highs..If the market makes new highs without the a/d line making new highs this will be considered a bearish divergence and the opposite applies for a bullish divergence. As you can see below there are no big warning signs based on these internals
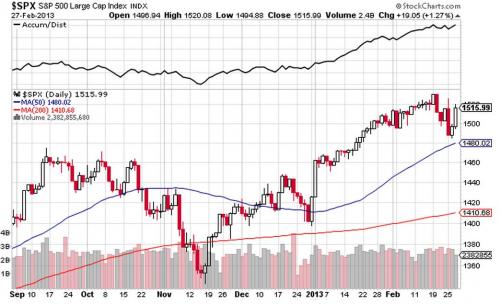
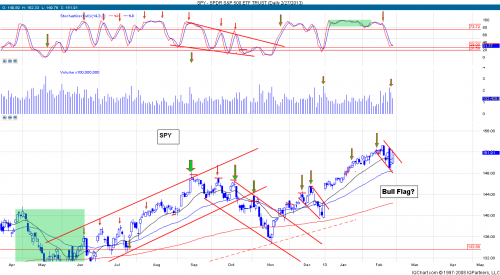
This chart looks very strong with the a/d line and recent new highs leading this market higher. There were 210 new highs today vs 27 new lows. I don't think the market is going to turn on a dime yet but give another push higher out of what now looks like a nice bullish flag in the markets
Don't forget I put out a Video also showing the updated HPS watch list
You can view it here http://youtu.be/nVEBk5IkgQQ
DayTraderRockStar
| 


